I Got 99 Observations and Your Bike Ain't Safe
Mar 04, 2026

DISCALIMER:** The views and opinions expressed in this blog are solely my own and do not reflect those of my employer, or any of its affiliates.
TL;DR; I spent seven months writing down four digits every time I went to the gym (which, as the data will reveal, was not as often as I’d like). Turns out your 10,000-combination lock is really a 100-combination lock, one digit is protected by an accident I’m calling Thumb Physics, and I built way too many interactive charts to prove it.
The Scene of the Crime
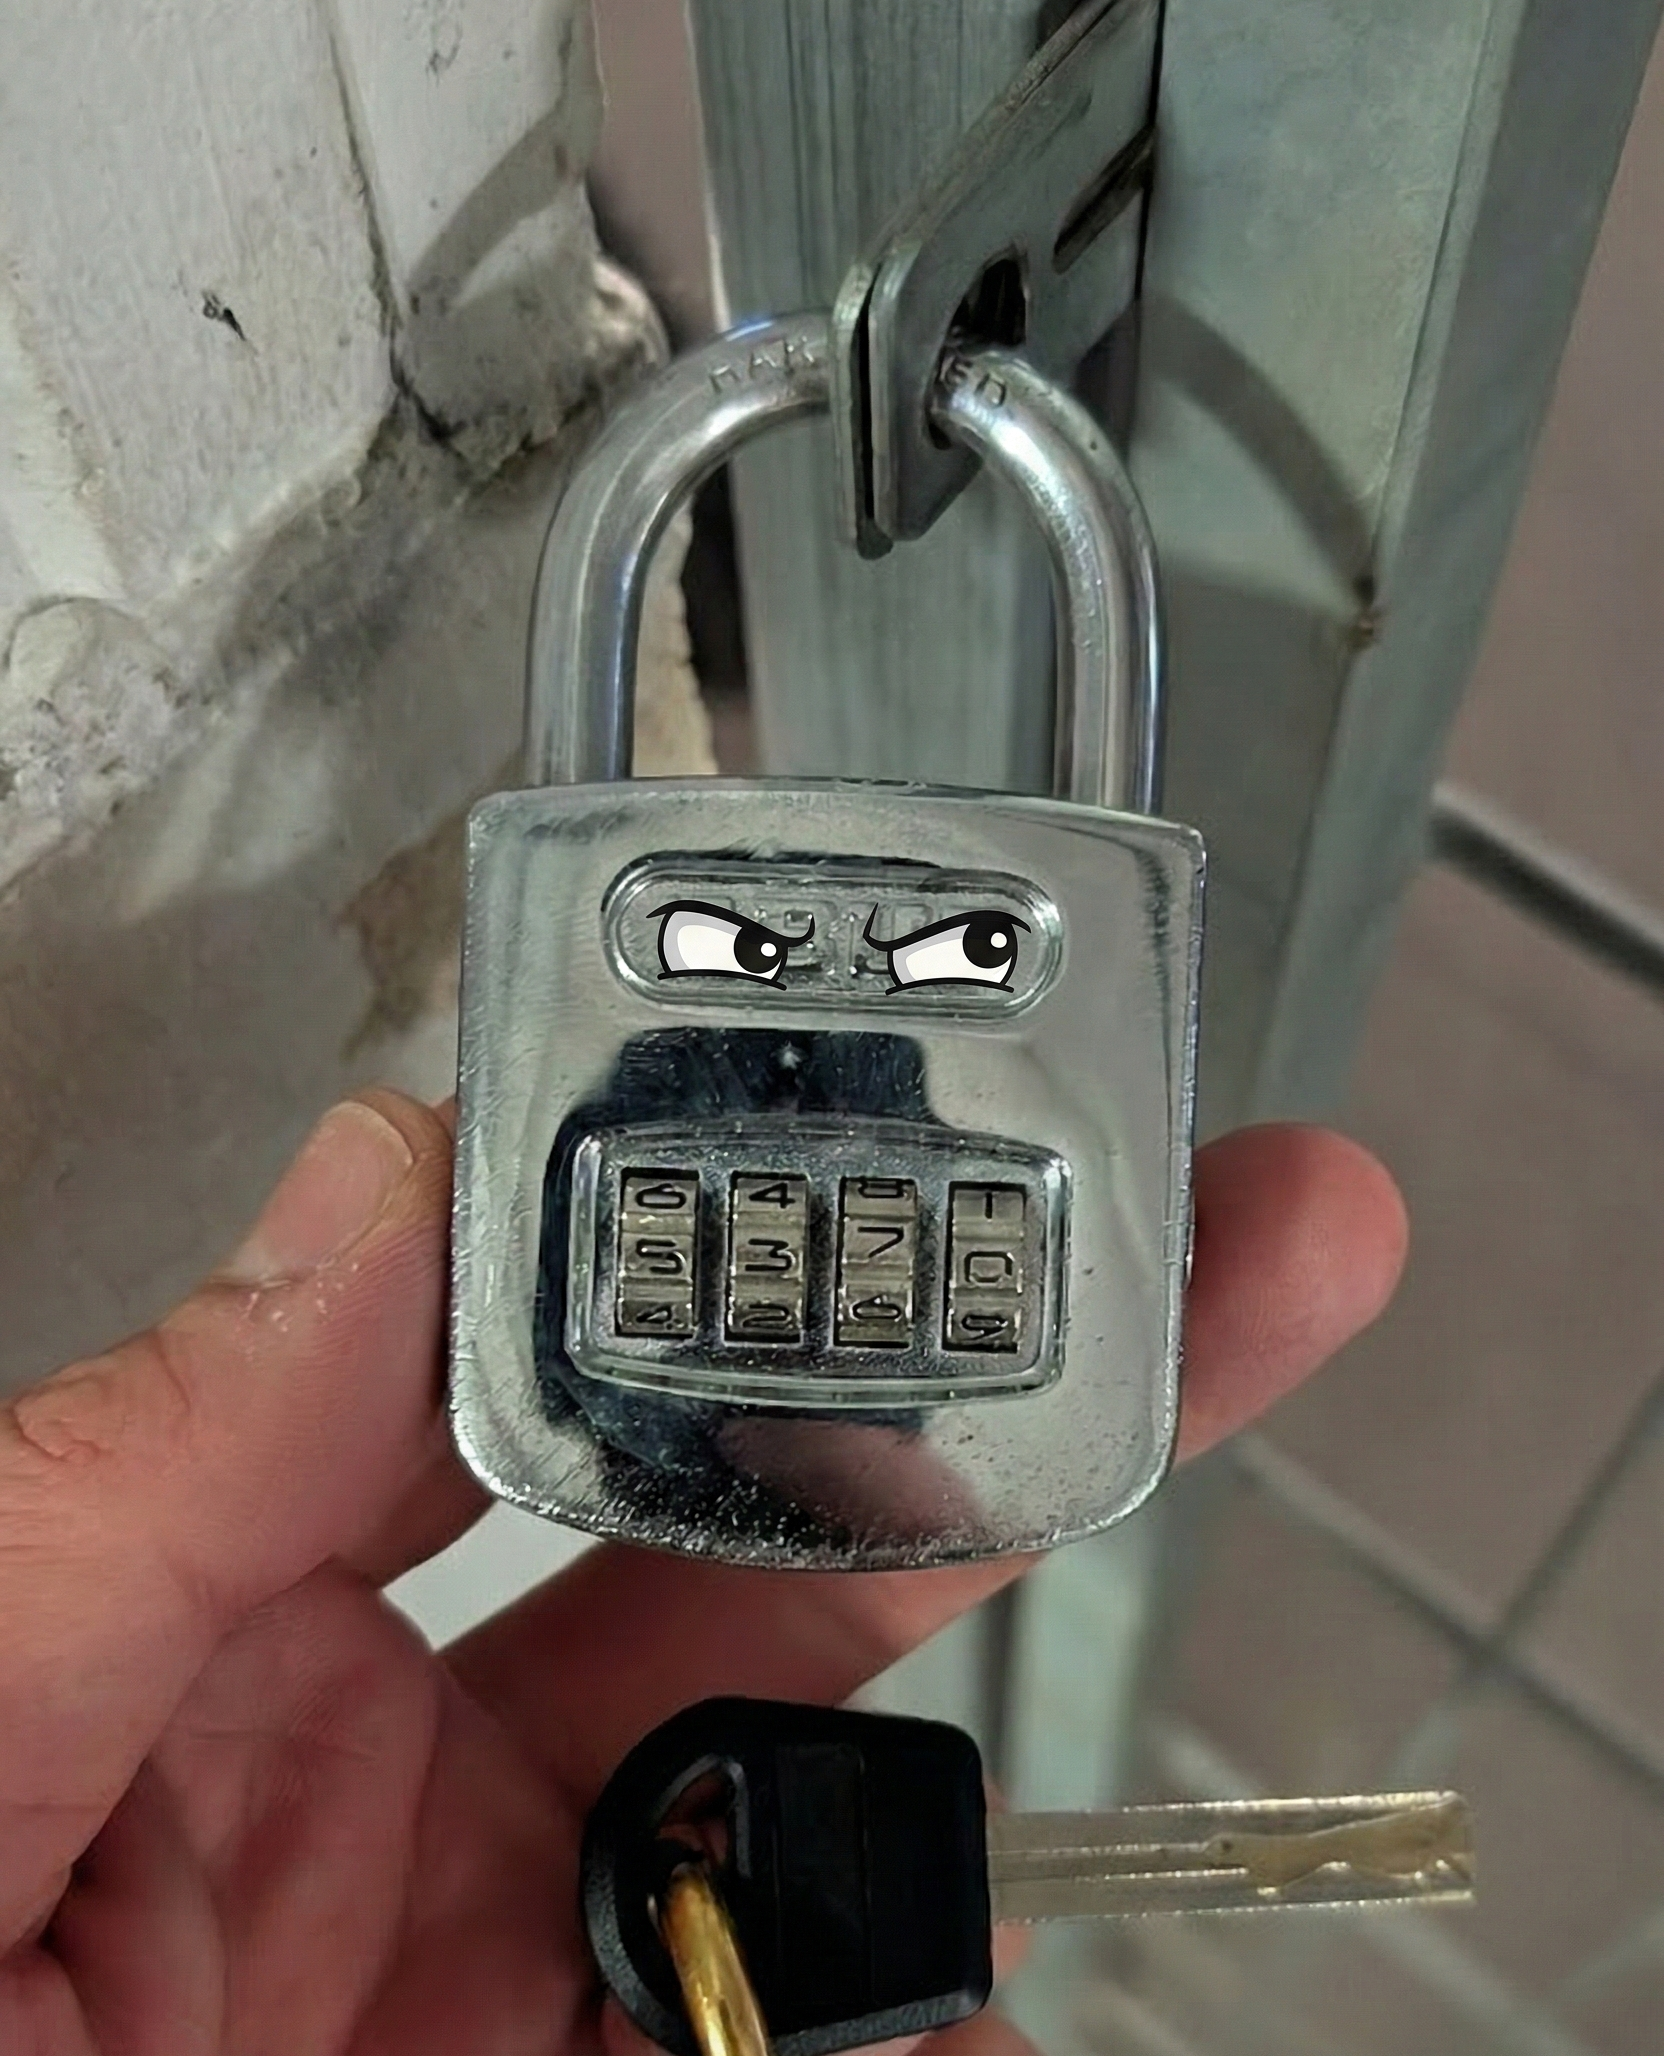
I live in an apartment building in Bonn. In the basement there’s a shared bike storage room, locked with one of those 4-digit rotary combination locks you’ve probably seen a hundred times: four little wheels, each showing a digit from 0 to 9, arranged horizontally. About 20 households share this lock, which means at least 20 people know the code, they spin the wheels to open it, park their bike, and (hopefully) scramble the digits before leaving.

10,000 possible combinations. Should be safe, right?1
Last year my building had a series of break-ins2. Someone got into the common areas, the private garages, even stole a couple of electric bikes from locked parking spots. But the bike room? Untouched. At first I was relieved. Then I started wondering: what if the thieves came back? They broke in once with alarming ease, and if they were patient enough to swing by the bike room every now and then, jot down what the lock shows, and keep a little spreadsheet going… could they eventually figure out the code and help themselves to everyone’s bikes?
Because every time someone opens that lock and scrambles it, the digits they leave behind aren’t random. Not even close. They’re the product of a quick thumb swipe across a physical mechanism, and if there’s one thing we know about humans, it’s that we are spectacularly bad at being random3. We think we’re scrambling, but what we’re actually doing is leaving a very readable fingerprint.
So I did what any reasonable person would do. I started writing down the numbers. 🕵️
Every time I went to the bike room, morning or evening, I recorded the four digits visible on the lock before entering the code. I kept this up from August 2025 through March 2026, seven months of diligently staring at a small metal object in a basement, 99 observations in total4.
A confession.
I've been a fan of Distill.pub for its entire lifetime. If you've never seen it: it was an online journal for machine learning that treated presentation as a first-class citizen. Interactive visualizations, marginal notes, beautiful typography. When they shut down in 2021, I was sad.
But recently I discovered that the Distill template, the web components, the styles, the whole framework, is still open source. Anyone can use it.
So this post is also an experiment: my first attempt at bringing Distill-style visualizations to my website. If you notice an unreasonable number of interactive charts in what follows, now you know why.
I regret nothing.
The Naive Attack
A thief walks up to your lock. They’ve been watching. What do they see?
The Wheels
Let’s start simple. Each wheel can show any digit from 0 to 9, and across 99 observations, some digits show up a lot more than others. The question is: how much more?
For each of the four positions I counted how often each digit appeared, and the result is below, shown as four polar bar charts (one per wheel). You can think of each chart as a top-down view of the physical wheel: digits 0 through 9 arranged clockwise around the circle, with bar length showing how often that digit was observed. The faint inner ring marks 10%, which is what you’d expect if scrambling were truly random5.
Take a moment to look at them.
Position 1 has a clear winner, one digit towering above the rest. Position 4 is similar, with a strong favourite. Position 3 is more contested, two digits fighting for the top spot. And position 2? Position 2 is a mess. There’s a vague winner, but nothing that screams confidence.
Now, if you were a thief and could only look at these charts, the obvious strategy would be to pick the tallest bar at each position and call it your guess. Statisticians call this “the mode” (the most frequent digit), but you can also call it “the obvious one”. That’s the naive frequency attack: just go with whatever shows up the most.
Now Guess
So let’s do exactly that. Pick the mode at each position. You get: 4-4-4-7.
Three out of four. Not bad for staring at histograms.
Positions 1, 3, and 4 are correct. Position 2 is wrong: the mode says 4, but the truth is 7. In practice this means a thief using this strategy has one digit left to figure out. Lock in the three confident positions, try all 10 options for the remaining one, and you’re done in under a minute.
But hold on. Are those three “correct” guesses equally trustworthy? Position 1’s mode dominated its chart, while position 3 barely won what was essentially a two-horse race. Should we really trust them the same way?
Spoiler: no. And that’s where things get interesting.
How Confident Should You Be?
Not all three correct guesses are equally reliable. Position 1’s mode appeared 27 times out of 99, with the runner-up at just 14. Position 3’s mode got 20, the runner-up 17. That’s a gap of 3 observations, which is to say: a couple of different neighbours showing up on a couple of different days, and the ranking could easily flip.
So how do we figure out which guesses to actually trust?
Bootstraping!
Here’s a thought experiment. Imagine you have a bag with 99 marbles, and each marble has a digit written on it, matching one of your observations for a given position. You shake the bag, pull out a marble, write down the digit, and put it back6. Then you do it again. 99 times total.
Now you look at your 99 drawn digits and ask: what’s the mode? Is it the same digit that won in the original data?
Maybe. Maybe not. Some marbles got picked twice, others got skipped entirely. The histogram looks slightly different every time. If the original winner had a big lead (like position 1, where 4 leads), it will almost certainly still win. But if it was close race (like position 3), a few unlucky draws and suddenly the runner-up takes over.
That’s called bootstrapping, and if the name sounds ridiculous, that’s because it kind of is. The idea is that you can pull yourself up by your own data, generating confidence from the same observations you already collected. I ran this process 100,000 times (my laptop was not happy about it) and counted: in how many of those simulated experiments does the original mode still come out on top? That percentage is your bootstrap stability, basically a measure of how much you should trust the guess.
Try It Yourself
Don’t take my word for it.
Click “Resample” a few times and watch what happens. Position 1 is absurd: digit 4 wins 96.4% of resamples, with a gap ratio7 of 54x over the runner-up. It doesn’t even flinch, no matter how many times you click. Position 4 is solid too: digit 7 takes it 81% of the time, gap ratio 5.1x.
Now look at position 3. Digit 4 wins 62% of resamples, but digit 1 is right there at 27%, breathing down its neck. The gap ratio is just 2.3x. This guess is probably right, but if you asked me to bet my bike on it, I’d want a few hundred more observations first.
And position 2? This is where it gets fun. On the surface, it looks stable: digit 4 wins 67.5% of resamples with a gap ratio of 4.9x. Seems perfectly fine, right? But the true digit at position 2 is 7. Poor, poor 7. It wins just 0.7% of resamples. The bootstrap is very confident here. Confidently wrong.
We’ll come back to that.
For now, the takeaway: positions 1 and 4 are cracked. Position 3 is likely cracked but shaky. And position 2 is telling us a very convincing lie.
So where does this leave our thief?
The Attacker’s Playbook
Now, I don’t want to give anyone ideas (okay, maybe I do, a little), but if you’ve been following along, you might have already realized that our hypothetical thief doesn’t need to be particularly smart. They just need to be patient and slightly methodical.
You’ve been watching the lock. You’ve done the frequency analysis. You know positions 1 and 4 are almost certainly 4 and 7. Position 2 looks solid: digit 4 wins 67.5% of resamples with a gap ratio of 4.9x. Position 3 is your weakest link: digit 4 wins 62% with a gap of just 2.3x.
A naive thief just tries 4-4-4-7 and either gets lucky or doesn’t. But a smarter thief reasons differently: lock in the two high-confidence digits (positions 1 and 4) and brute-force the remaining two. Positions 2 and 3 each have 10 possible digits. That’s 10 × 10 = 100 combinations to try.
Your 10,000-combination lock just became a 100-combination lock.
And an even smarter thief (we’re really levelling up here) doesn’t try them randomly. They rank the 100 codes by likelihood and work down the list, most promising first. Attempt #1: 4-4-4-7, the all-modes guess. Attempt #2: swap in position 3’s runner-up: 4-4-1-7. And so on. Each attempt takes maybe 3 to 5 seconds on a rotary lock. If the true code happens to be near the top of the ranked list, you’re done in under a minute. Even in the worst case, 100 attempts is 5 to 8 minutes.
The Search Space
Here’s what the thief’s ranked list looks like.
To see why this works, let’s look at the full space of 10,000 possible codes, ranked by how likely they are under our frequency model8. The green bars are codes inside the attack zone (everything matching 4-?-?-7), the gray bars are everything else. You’ll notice that some gray codes rank higher than many green ones, and that’s because a code like 4-4-4-0 can still score well if its individual digits are all frequent, even though it falls outside the attack zone.
The true code, 4-7-4-7, ranks #23 out of 10,000 by likelihood. But that rank isn’t stable: across bootstrap resamples it bounces around quite a bit9. What matters is that about 73% of the time, the true code falls within the top 100. The attack zone works.
So here’s the recipe for our thief. Observe the lock about 100 times. Pick the mode at positions 1 and 4. Rank the remaining 100 combinations by frequency. Start at the top. On a good day, you’re in within a couple of minutes.
The Stubborn Digit
This is the part that kept me up at night. And I mean that almost literally, because once you see the pattern, it’s the kind of thing that makes you stare at your ceiling wondering if statistics is broken.
Position 2’s true digit is 7. In our data, it appears 9.3% of the time. That’s below the 10% you’d expect from perfectly random scrambling. The mode, digit 4, shows up at roughly 20%. So not only does the true digit lose, it loses to what should have been random noise. It’s like entering a race and finishing behind someone who wasn’t even trying.
And here’s the kicker: more data makes this worse, not better.
To understand why, I did what any self-respecting data person does when reality refuses to cooperate: I simulated a version of reality where I could control the sample size and watch what happens. Take the observed frequency distribution at position 2 and use it as ground truth. Draw N synthetic observations from it, look at the frequencies of digit 4 and digit 7. Repeat 20,000 times. Do this for N = 10, 25, 50, 100, all the way up to 5,000.
It’s essentially the same bootstrapping idea from before, just with a dial for sample size. And the results are, honestly, a bit devastating.
The Divergence
The chart below shows two lines: the observed frequency of digit 4 (the wrong mode, in red) and digit 7 (the true code, in green). The shaded bands are the 95% confidence intervals at each sample size. Drag the slider to change N.
Here’s what you’ll notice. The gap between the two lines never changes. It’s always about 10.3 percentage points, whether you’re looking at N=10 or N=5,000. What changes is the uncertainty around each line. At small N, the bands are wide and overlapping, and you genuinely can’t tell the two digits apart. Maybe digit 7 really is more common and you just got unlucky. There’s hope.
Now drag the slider to the right. Watch the bands shrink. By N=100 (roughly what I collected), they barely touch. By N=500, they’re fully separated. No overlap. No ambiguity. Digit 4 is observed more often than digit 7, and it’s not even close.
The gap was always there. More data doesn’t close it. It just removes any hope that it might be noise.
A thief looking at this data would have absolutely no reason to doubt the conclusion. Every statistical test in the book would confirm it: digit 4 appears twice as often as digit 7 at position 2. Pick 4. Move on. And they’d be wrong.
This is not a sample-size problem. It’s a signal problem. The scrambling process at position 2 actively buries the true digit under a false favourite. Three out of four positions are recoverable with enough patience. But the fourth is protected, not by design, but by accident.
Which brings us to the obvious question: why? What is it about position 2 that makes the data lie?
The Physics of a Thumb
I’m fairly sure Thumb Physics is not an established branch of science. If it is, I’d like credit for arriving at it independently. If it isn’t, I’m claiming it. Put it on my tombstone.
Anyway. Let’s step back from the statistics for a moment.
The lock is horizontal. Four wheels in a row. When someone scrambles it, they don’t carefully and independently rotate each wheel like some kind of safecracker in a movie. They swipe a thumb across all four wheels in one quick motion, usually left to right, and call it a day.
This simple physical fact explains a lot. But not everything.
Inner vs Outer
The outer wheels (positions 1 and 4) sit at the edges of the thumb’s arc. They get clipped, nudged, sometimes skipped entirely. The inner wheels (positions 2 and 3) are right in the middle of the swipe and receive the full force of the rotation.
The data backs this up. Outer positions stay unchanged (showing the true digit) roughly 30% of the time, while inner positions only about 10 to 15%10. The difference is statistically significant. Your thumb simply doesn’t reach the edges as well as the middle, which makes intuitive sense if you’ve ever tried to swipe four tiny wheels with one finger.
This explains why positions 1 and 4 are easy to crack: they don’t get scrambled enough, so the true digit still shows through in the frequency data. But it doesn’t explain position 2’s specific problem. Why does digit 4 dominate there when the true digit is 7?
The Mystery of Position 2
I had a beautiful theory for this: the “neighbour effect.” Position 2 sits between two 4s, so maybe the thumb leaks the neighbours’ digit into it. Elegant! Then I checked position 3, which sits between two 7s. Its mode is 4, not 7. Theory dead on arrival.
Here’s what we actually know. Digit 4 is the most common digit at three out of four positions. Across the entire lock, it appears at 19.1%. It’s not just popular at position 2, it’s popular everywhere. It seems to be generically “sticky” on this lock, showing up far more than its fair share regardless of what the true digit is.
Why? I don’t have a satisfying answer, and believe me, I tried. It could be something about the physics of this particular lock, or maybe something about rotary locks in general, that we simply can’t disentangle with one lock and 99 observations. If you’re a locksmith or a biomechanics researcher reading this, I would love to hear your theories.
The data shows the pattern clearly. The mechanism remains a mystery.
So, Can You Steal My Bike?
Probably. Yes.
Positions 1 and 4 are trivially recoverable, with the true digits dominating the frequency data from as few as 25 observations. Position 3 is recoverable but shaky, the kind of result that would benefit from a few hundred more data points before you’d feel truly confident. And position 2 is protected by what I can only describe as a statistical accident: the true digit appears below random chance, and the more data you collect, the more confidently the analysis points you in the wrong direction.
Your 10,000-combination lock provides the security of about 100 combinations. A patient observer with roughly 100 data points (seven months of gym trips, in my case, with some embarrassing gaps in between) can rank those 100 by likelihood and brute-force through them in a few minutes. About 73% of the time, the true code is in there.
Or you could just cut the lock. Probably faster.
The dataset is available at the end of this post if you want to replicate the analysis or try to do better than naive frequency. I’m still collecting data11. And no, I haven’t changed the code. For science.
⬇ Download dataset (LockDigits.csv)
Footnotes
-
We also had a break-in in our apartment that year. It was rough. On the bright side, it eventually led to us getting our two cats, Alba and Nera.
 . Grazie, ladri. ↩
 -
Figurska, Stańczyk & Kulesza (2008), “Humans cannot consciously generate random numbers sequences.” Published in Medical Hypotheses. Best paper title in the history of science. ↩
-
Not 100. I stopped at 99 because I wanted you to feel the same mild frustration I felt staring at position 2 (more on that later). Also, I use the bike mostly to go to the gym, so the data collection was… seasonal. There are some heroic stretches of daily observations and some long, suspiciously lazy gaps where I clearly didn’t leave the house weeks. ↩
-
If every digit were equally likely after scrambling, each would appear 10% of the time. That ring is your null hypothesis, staring back at you. ↩
-
This “put it back” part is important. It means the same observation can be picked more than once in a single draw, and some observations won’t be picked at all. This is what statisticians call sampling with replacement. It’s the key ingredient that lets you simulate variability from a single dataset. ↩
-
The gap ratio is simply how many times more often the winner beats the runner-up across all resamples. A gap of 54x means digit 4 won 54 times more often than the second-place digit. In the visualization, you can see it as the bracket between the top two bars in each panel. ↩
-
The likelihood of a code is the product of per-position observed frequencies. For code 4-4-4-7, you multiply the observed frequency of digit 4 at position 1 × digit 4 at position 2 × digit 4 at position 3 × digit 7 at position 4. ↩
-
Median rank: 44. Mean: 105. 95% CI: [3, 574]. Sometimes the true code is in the top 10, sometimes it’s in the hundreds. About 54% of the time it’s in the top 50. ↩
-
Fisher’s exact test gives p=0.011 for the inner/outer asymmetry. Significant at the 5% level. ↩
-
If you live in my building: hi 👋. Please keep scrambling normally. It’s for research. ↩

If you like my work, consider buying me a coffee to support future posts.
