Horizon AI Fragmentation: Challenges and Budget Efficiency
BlogPostSep 23, 2024

Preface(?)
So, this post will be a bit different from the previous ones. Usually I write (and in general interface with the digital world) with a LLM. The process is something like this:
- Me: hey ChatGPT can you write an email for this guy saying…
- ChatGPT: Sure, here’s a 10 pages long email you can send to the guy.
- Me : ** angry italian noises **
While this is saves me some time, I also feel like I’m loosing my writing style and probably wasting away the part of my brain that is responsible for this task (cough cough navigation skills).
So this post is different. I wrote it from scratch and then ask chatpgt to fix here and there. Hope you like it!
Introduction: The Fragmentation of AI Research in Europe
You would think that with all the recent talks about Europe aiming to be a global leader in AI, we would see a smooth, coordinated strategy when it comes to AI research and deployment. But the reality paints a different picture, one full of fragmentation and inefficiencies1. Despite the significant resources and funding from programs like Horizon Europe, the AI research landscape feels scattered, with projects overlapping and efforts being duplicated. The result? Slower progress, wasted resources, and a European AI community that struggles to keep up with global players like the US. and China2 .
But is Horizon really that inefficient? To answer that, I downloaded the list of funded projects from the CORDIS EU Research Projects database and did some analysis myself3. In the next section, we’ll explore what the funding landscape actually looks like, offering insights and opinions. For a quick summary of the results, you can jump to the Conclusion.
Analysis of Horizon Budget Allocation
To get it straight, our aim is to demonstrate that many Artificial Intelligence (AI)-related projects funded under the Horizon Europe program are similar in scope and objectives. As I mentioned earlier, the dataset comes from the CORDIS EU Research Projects database and contains information on 13,674 projects funded between 2021 and 2027.
Each project is represented as a JSON object, which looks something like this (randomly chosen, of course \s):
{
    "acronym": "TrustLLM",
    "contentUpdateDate": "2023-11-03 12:04:45",
    "ecMaxContribution": 6929701,
    "ecSignatureDate": "2023-10-20",
    "endDate": "2026-10-31",
    "frameworkProgramme": "HORIZON",
    "fundingScheme": "HORIZON-RIA",
    "grantDoi": "10.3030/101135671",
    "id": 101135671,
    "legalBasis": "HORIZON.2.4",
    "masterCall": "HORIZON-CL4-2023-HUMAN-01-CNECT",
    "nature": "",
    "objective": "The TrustLLM project will develop European [...]",
    "rcn": 257895,
    "startDate": "2023-11-01",
    "status": "SIGNED",
    "subCall": "HORIZON-CL4-2023-HUMAN-01-CNECT",
    "title": "Democratize Trustworthy and Efficient Large Language Model Technology for Europe",
    "topics": "HORIZON-CL4-2023-HUMAN-01-03",
    "totalCost": 6929702.5
}
Filtering AI Projects
The first step is to look for projects related to AI. To do that, I complied a list of AI buzzwords using TELUS Digital’s list of beginner AI terms. After several rounds of refinement to remove overly specific terms, we have the following list of words to filter projects based on their presence in either the project title or objectives:
AI buzzwords
machine learning, artificial intelligence, ai, data analysis, neural network, deep learning, robotics, big data, robot, natural language processing, computer vision, reinforcement learning, data governance, pattern recognition, intelligent control, object recognition, autonomous car, computational linguistics, supercomputer, image recognition, expert system, supervised learning, autonomous robots, speech recognition, predictive modeling, swarm intelligence, emotion recognition, decision theory, evolutionary algorithms, nlp, bayesian network, automated reasoning, machine perception, genetic algorithms, probabilistic reasoning, intelligent agent, llms, hidden markov model, markov decision processUsing these, we can find 2,065 AI-related projects.
Interestingly, the 10 most common AI words in these projects were:
- Machine Learning: 726
- Artificial Intelligence: 373
- AI: 309
- Data Analysis: 118
- Neural Network: 118
- Deep Learning: 86
- Robotics: 84
- Big Data: 72
- Robot: 27
- Natural Language Processing: 25
Most of the words are fairly general, such as ML and AI, but we can also spot more specific fields, like NLP and data-related terms.
Time Analysis
First things first, let’s see how these projects are distributed in terms of their start (startDate), end (endDate) and duration.
Project Duration
A quick analysis of project durations reveals an average duration of 41 months (3.4 years) ± 12 months. The shortest project lasts 6 months, while the longest stretches to 85 months (more than 7 years)!
Cool, but if we look at how many projects last a particular number of years, we get a clearer picture:
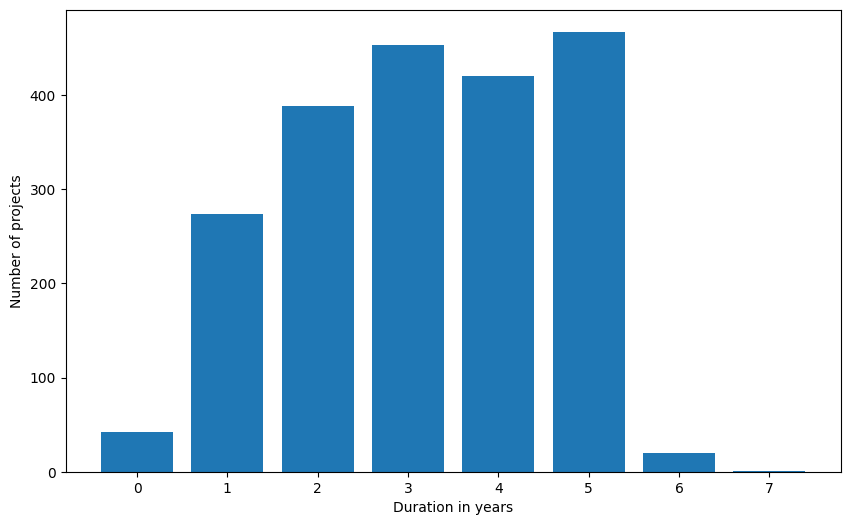
The majority of projects are under 5 years in duration, with the 50th percentile below 3 years and the 70th percentile below 4 years. This suggests that many projects may be too short to achieve meaningful results, given the complexity of (AI) research.
Project Start and End Dates
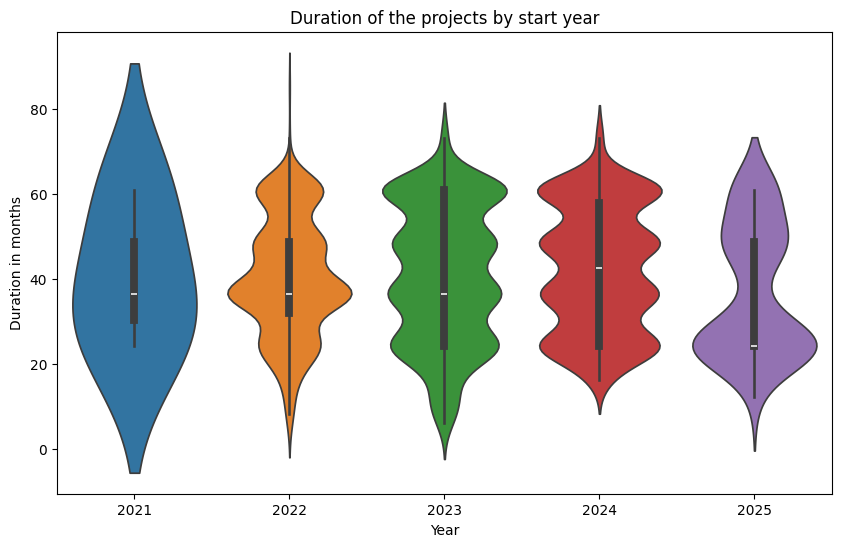
Since this is supposed to be a nice and entertaining blog post about a (possibly) boring topic, I also wanted to show some nice violin plots to illustrate how the start and end year influence the duration.
 |
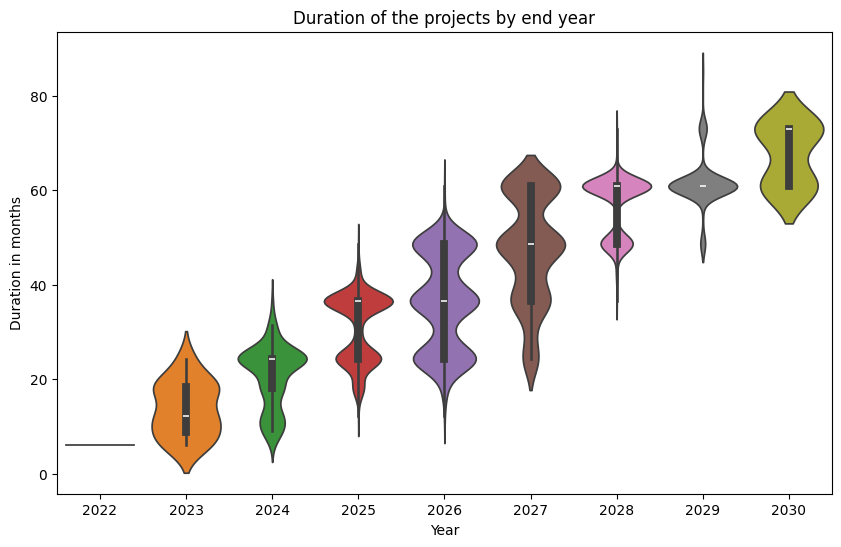 |
While these may not serve much beyond making the post look nice, we can clearly see a positive correlation between the duration and the end year (duh!). More interestingly, projects starting in 2021 have a more homogenous duration (not surprising, as they are the ones lasting the longest), while all others have more defined durations (mostly multiples of 12 months). Finally, projects starting in 2025 tend to have a more limited duration of 1-2 years.
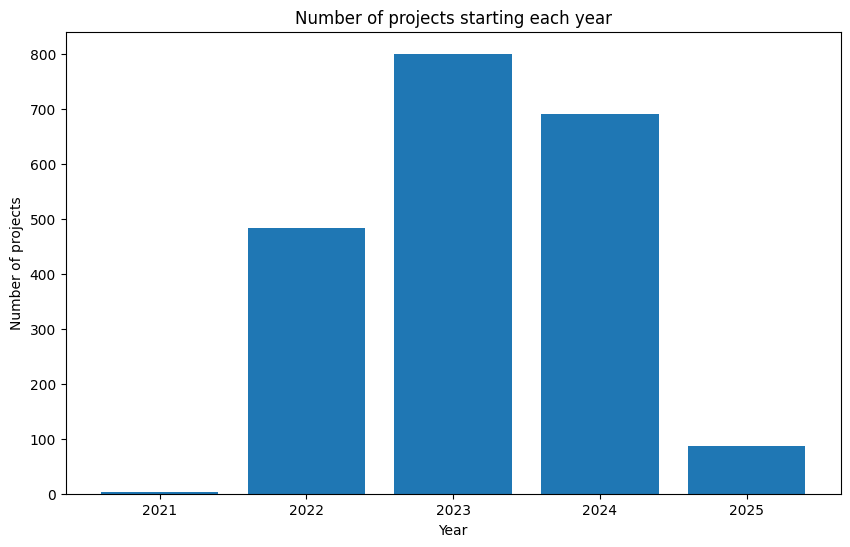
If we want to explore something more interesting, we can check, like before, how many projects start and end each year:
 |
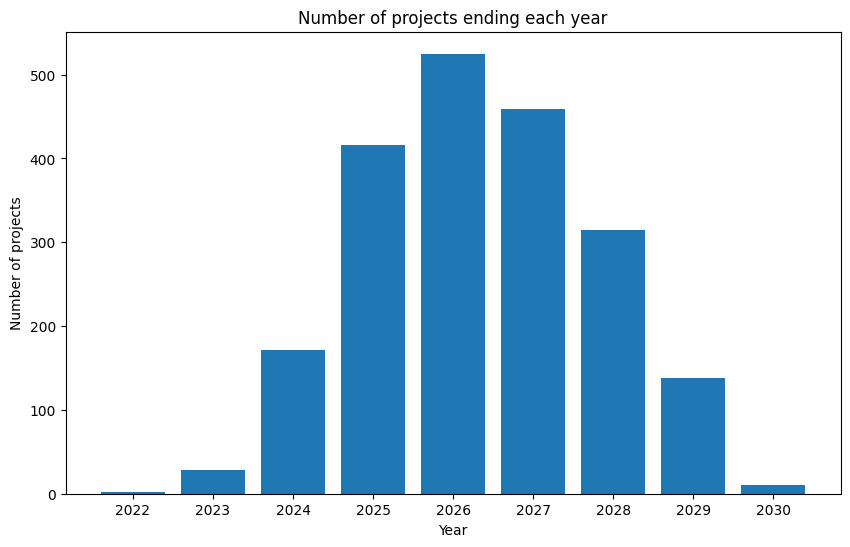 |
What we can see is the last project is scheduled to finish 10 years after the start of Horizon Europe. Given the rapid pace of AI advancements, projects with such long durations and a fixed project scope may risk becoming outdated. Additionally, more than half of the projects will conclude after 2026. What happens next? More Horizon funding cycles?
Budget Analysis
We now have a pretty clear idea of how these projects are distributed over time, but what about the resources they access?
To figure that out, we can look at the ecMaxContribution field 4.
A simple analysis reveals that the average budget is €3.161M, with a surprisingly high standard deviation of €3.4M (107.5% of the average!). Moreover, the minimum budget seems to be €75k, while the maximum reaches €46.255M (nicely done, FP3 - IAM4RAIL!).
Again, let’s check how many projects fall into the various million-euro clusters:
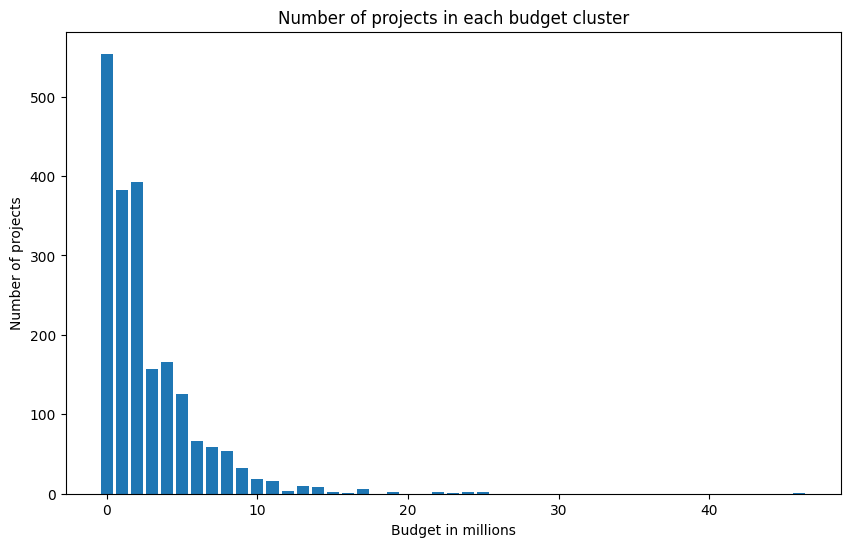
Most of the projects are below €10M. Indeed, approximately 70% of projects have budgets below €3 million, and 90% are below €7 million. Let’s say you want to train the next ChatGPT/LLama3 or whatever (cough cough EuroLingua), how much would you need to spend? Well, according to Forbes GPT-3 required at least $5M worth of GPUs, and Sam Altman mentioned that foundation models can cost more than $100M.
I know foundation LLMs aren’t the only type of AI, and there is much more to the landscape. However, a high amount of computation is now required for most impactful AI applications 5. What can you do with €5 million?
But how does the budget get allocated? Of course, a major part depends on the project requirements, however I would also guess it depends on the project duration. Well, yes and no. By running a Pearson correlation, we find a modest positive correlation (0.31, p-value < 0.0001), indicating that longer projects tend to have higher budgets. Interestingly, earlier projects tend to have slightly lower budgets (-0.11, p-value < 0.0001), which could be due to their shorter durations.
How Much is €5 Million?
When I hear, “our project got €5M here or €7M there”, I’m usually like, “ok, cool.” I find it hard to grasp how much that actually is. So here I am, estimating the monthly average: €73,578.25 (again, savage std €79,428.91 (108% of the average)) with a minimum of €2,835.62 (lower than one researcher’s salary) and a maximum of €950,627.63 (the price of 60 Ford Fiesta)
Words, words, words
Keeping the real aim of this analysis (fancy plots) in mind, I went back to the project objectives and titles and created this very appealing word cloud:
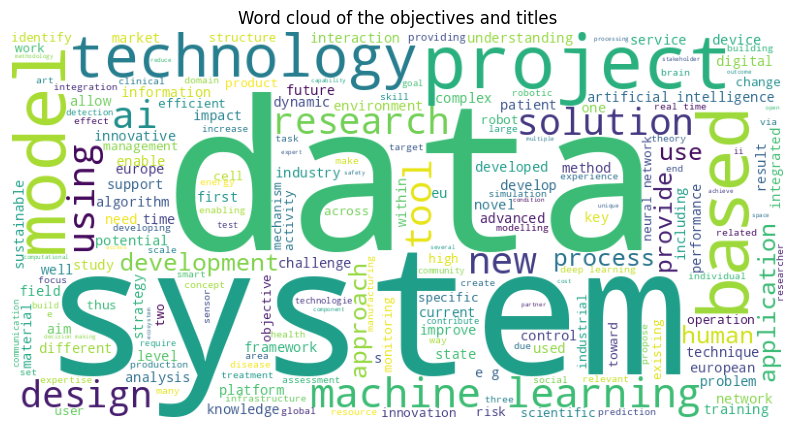
As you can see, the term data is the most present (3,621 occurrences), validating my decision to work in the data team and making me quite happy. The other noticeable words are listed below:
Most common words with occurrences
- data: 3621
- ai: 2600
- project: 2259
- learning: 1968
- based: 1968
- new: 1753
- research: 1685
- system: 1616
- technology: 1551
- model: 1526
- approach: 1211
- machine: 1159
- development: 1148
- use: 1103
- develop: 1101
- network: 1077
- high: 1063
- aim: 1004
- the: 1002
- human: 980
But honestly, they don’t really explain much.
Do Certain Words Entail Higher Budgets?
Earlier, we noticed that the budget is only partially correlated with the duration of a project. Now, let’s see if the remaining correlation relates to the actual scope of the project.
To explore this, I used my beloved scikit-learn library with a TfidfVectorizer to transform words into vector 6 and a simple Ridge7 model.
 |
 |
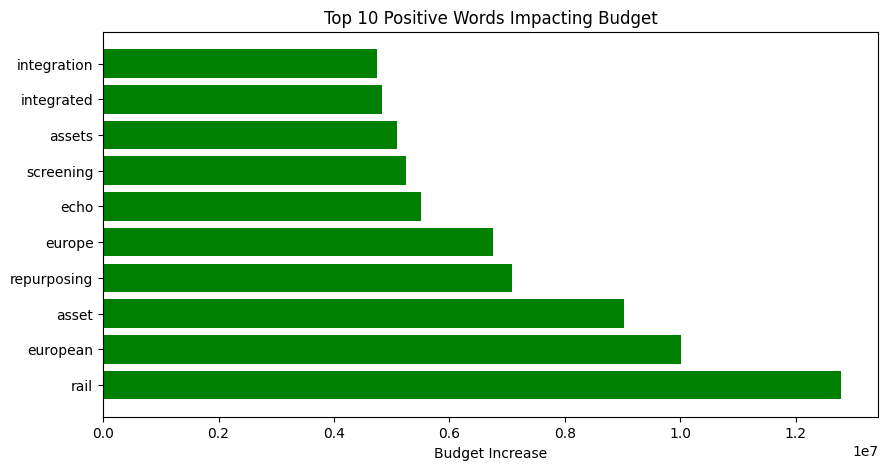
The results are interesting. Looking at the top 10 words, we find terms related to infrastructure, like rail and asset/s. Other words, such as echo and repurposing, suggest environmental projects. Finally, words like wafer and metrology might indicate projects focused on electronics and semiconductor technologies, aligning with the EU’s priorities to reduce dependency on foreign technologies.
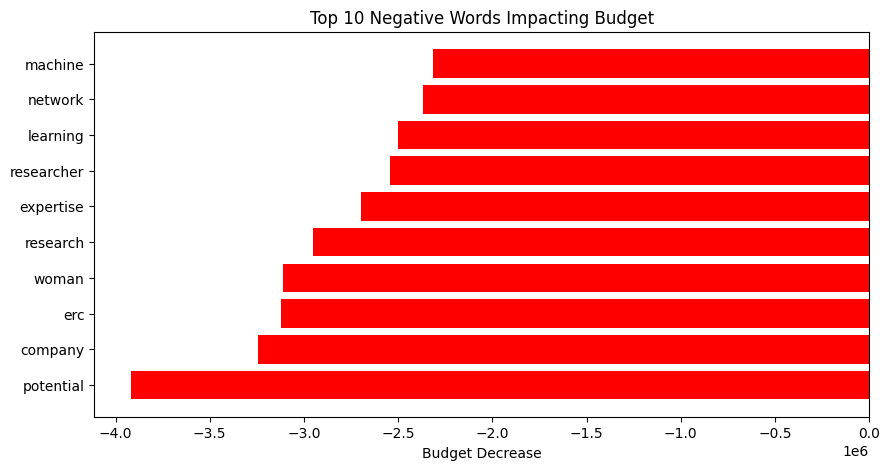
On the other hand, if we look at words associated with lower budgets, we find several technical terms such as machine, learning, and networks. Others, like researcher, research, and potential, may point to more research-oriented projects rather than ones with direct applications. And finally, the big word I tried to ignore: “woman”. So, there are plenty of limitations with this analysis (linear model, context of the word, correlation is not causation, and maybe a few bugs). I don’t want to imply anything, but it might be worth investigating why this word seems correlated with lower budgets. Let’s say I’ll leave that for future work.
What About Topics?
So, we have seen correlation between budget and words, but you know what describes the project’s topic better than it’s description? Its topic.
There are a total of 491 different topics, most of which fall in the Marie Skłodowska-Curie Actions (MSCA) and European Research Council (ERC) grants, indicating a focus on fostering individual researchers and research teams.
If we apply the same methodology to check how topics correlate with budgets, we get a different picture:
 |
 |
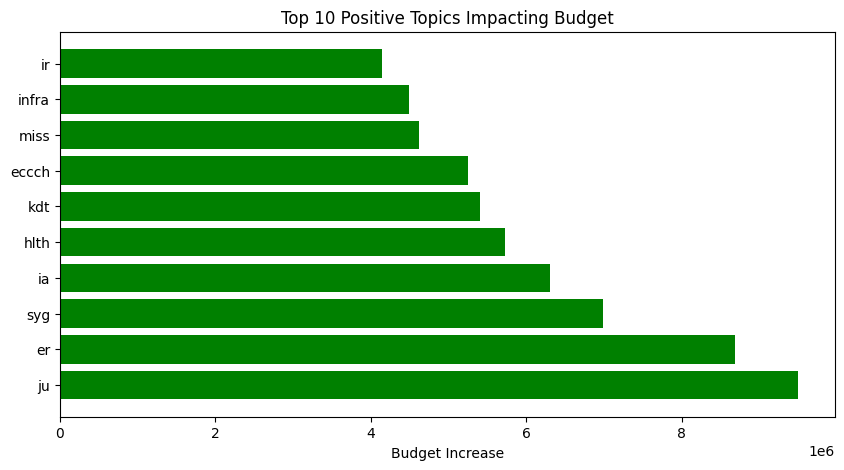
Specifically, higher budgets are associated with :
- Large-Scale Initiatives: Words like Joint Undertaking (ju), Innovation Actions (ia) , Key Digital Technologies (kdt), and Missions (miss) indicate projects that are part of significant EU initiatives or partnerships, which naturally require and receive more substantial funding.
- Strategic Priority Areas: Health (hlth), Key Digital Technologies (kdt), and Infrastructure (infra) are high on the EU’s agenda, leading to larger investments.
- Collaborative Projects: Terms like syg (Synergy Grants) and ir (Industrial Research) suggest collaborative efforts that necessitate higher budgets.
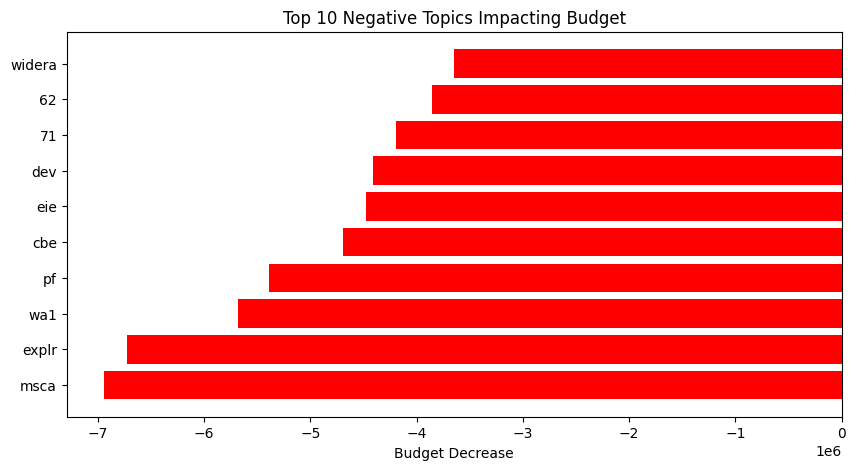
On the other hand, lower budgets are mostly associated with:
- Individual Fellowships and Small Teams: Marie Skłodowska-Curie Actions (msca) and Postdoctoral Fellowships (pf) are focused on individual researchers, leading to smaller funding amounts which makes sense. Also, as we have seen before msca are the majority of the funded topics.
- Early-Stage or Exploratory Research: Words like Exploratory (explr) and Development (dev) indicate projects that are in preliminary phases, often receiving less funding.
- Coordination and Networking Activities: European Innovation Ecosystems (eie) and Widening Participation and Strengthening the European Research Area (widera) focus on ecosystem building and policy support rather than direct research and innovation. In my opinion, it’s unfortunate that so few projects (62 for eie and 66 for widera) focus on building ecosystems and strengthening AI cohesion, especially since this is the main topic of my post.
Project Similarity
Finally, we get to the point. Our initial aim (before getting lost in numbers) was to check if, and how many, projects share similar objectives.
Our initial assumption was that similar projects share similar descriptions, and although we don’t have access to the complete proposal, we do have a summary in the objective and title.
For this purpose, I used a SentenceTransformer to embed the objectives and titles. With this, we can then run a cosine similarity between the embeddings to see which ones are closer together. Thanks to a mix of Huggingface and Pandas, this was easier done than said.
After computing the similarity between each possible pair, I got this nice distribution:
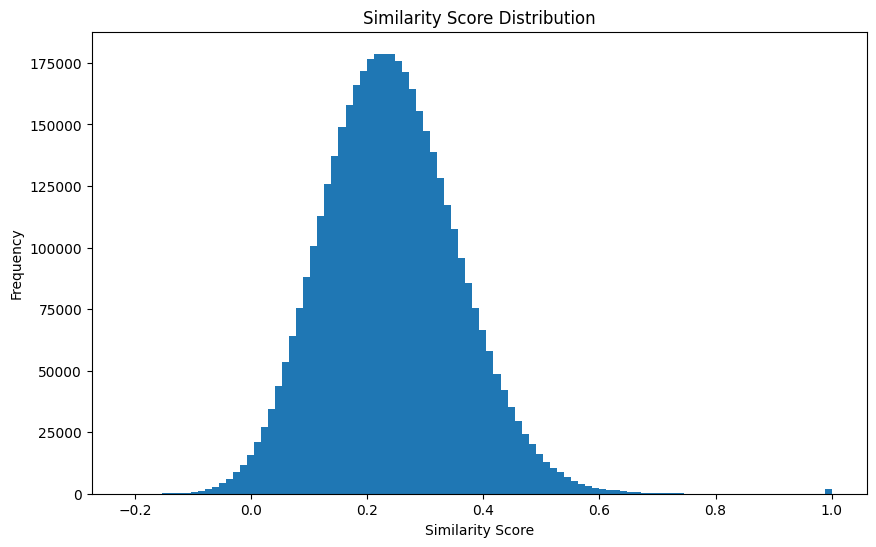
The cosine similarity returns a value between 0 (very different) and 1 (practically the same). The average for our projects is a healthy 0.24 (± 0.12), which indicates that most projects are not similar to each other (nice!).
Now, let’s take an arbitrary number and see how many pairs are similar to each other. If we choose, for example, 0.7, we get 478 pairs.
So are we done? Can we conclude that there are plenty of similar projects? Absolutely not! This metric only reveals that 478 pairs have similar wordings. Nothing is said about the project itself. So how do we sift through almost 500 pairs of projects without getting fired for not showing up to work?
Well, well, well…
What Does ChatGPT Say?
Inspired by HuggingFace and what they’ve done with the FineWeb Dataset, I decided to use ChatGPT’s APIs to get the model to assign a merge score to each project pairs.
I used a prompt similar to FineWeb-Edu:
ChatGPT promt
You are tasked with evaluating the similarity between two research projects and determining whether they should be merged. The projects will be evaluated on five criteria using an additive 5-point scoring system based on how well they satisfy each criterion:- Add 1 point if the projects share some minor objectives or methods but differ significantly in most areas.
- Add another point if the projects have some overlapping goals, methodologies, or innovations, but also include distinct elements that make them different enough to proceed separately.
- Award a third point if the projects share key similarities in scope, methodology, and innovation but retain enough distinctions to benefit from remaining independent. Resource efficiency may not be substantial, and merging may only yield moderate benefits.
- Grant a fourth point if the projects align closely in scope, methodology, and innovation, and combining them would improve resource efficiency. Merging would likely benefit the overall research output, but they could still function separately with some loss of efficiency.
- Bestow a fifth point if the projects are nearly identical in scope, methodology, and innovation. Merging them would significantly optimize resource use, and keeping them separate would be inefficient.
After scoring each criterion, summarize your analysis in a brief justification, considering the potential benefits of merging and any reasons against merging. Conclude with a structured JSON output containing the parameters "score" and "justification".
The projects:
PROJ1
PROJ2
Where PROJ1/2 are later substituted with the actual projects.
I used the model version gpt-4o which is cheaper and faster than the standard one. I let it run for a while… it took about 20 minutes until I reached my daily quota and it crashed. Thankfully, I was able to salvage the results, which meant 316 out of 479 pairs were completed. That means 196 projects and €3.9 (0.012525 per comparison), which is actually fair.
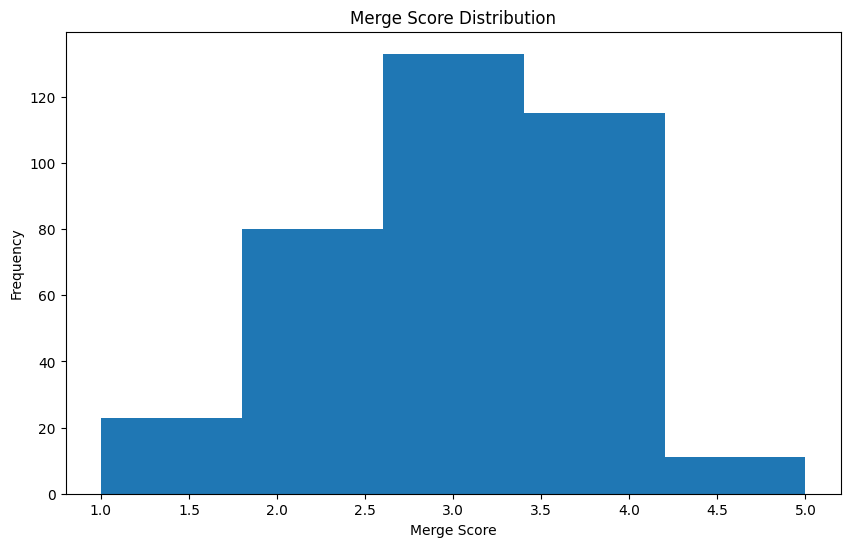
If we check the scores, we can see how there are only a few higher than 4. Most of them seem to fall between 3 and 4. Nice! Let’s see what kind of projects are similar:
Similarity vs. Merge Score
Before checking the actual results, I was curious to see if the cosine similarity score would correlate with the merge score from ChatGPT. To my surprise, this was only slightly true (0.14, P ≈ 0.009), which means that similar wordings do not strongly correlate with what ChatGPT considers similar projects.
Similar Projects
To find similar projects, we need to build a graph where each node represents a project and each edge is the merge score that connects them. Seems complicated but luckily networkx provides all the tool we need.
If we consider a threshold of 3 to be enough to merge projects together, we get the following result:
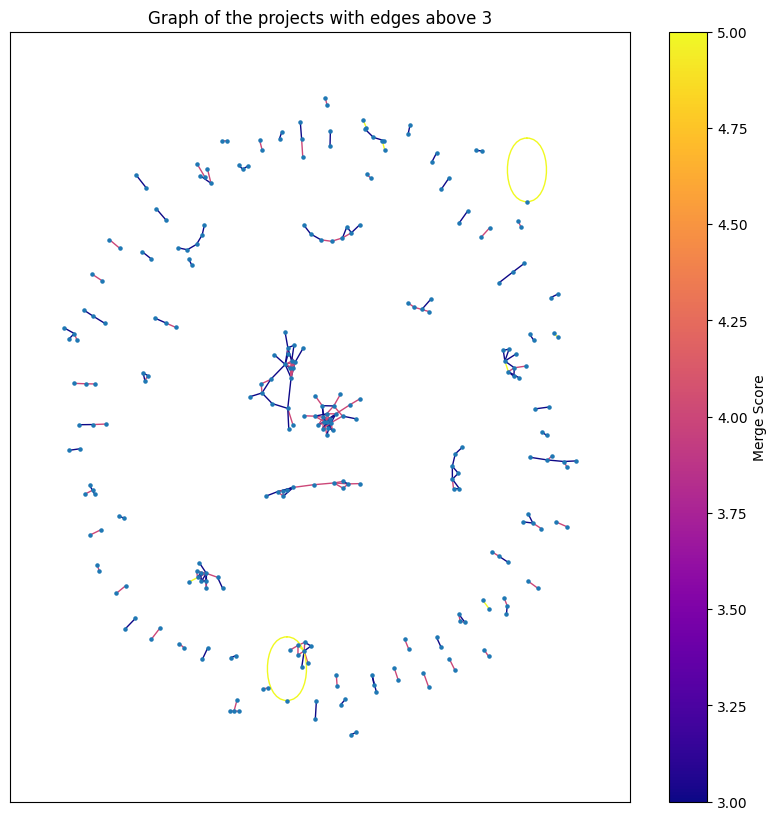
We can see that there are a few clusters of many projects (in the middle) with a similarity score of 4, and a constellation of pairs on the outside. Specifically there are 84 connected components8 with an average size of 3 and max of 22 (projects similar to each other)!
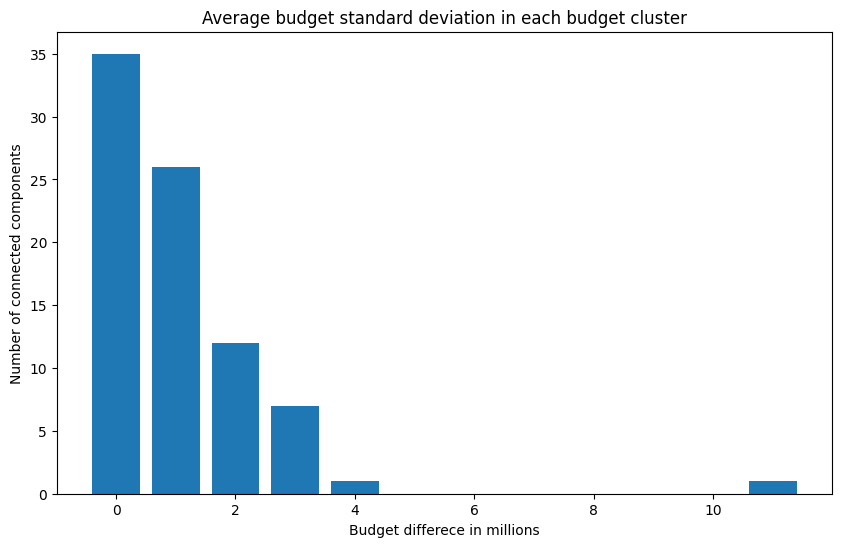
That’s nice, however we should still check if these projects are similar in terms of resources. To do this, I calculated the standard deviation of both the duration and budget for each connected component. This gives us an idea of how dissimilar these values are within the components:
 |
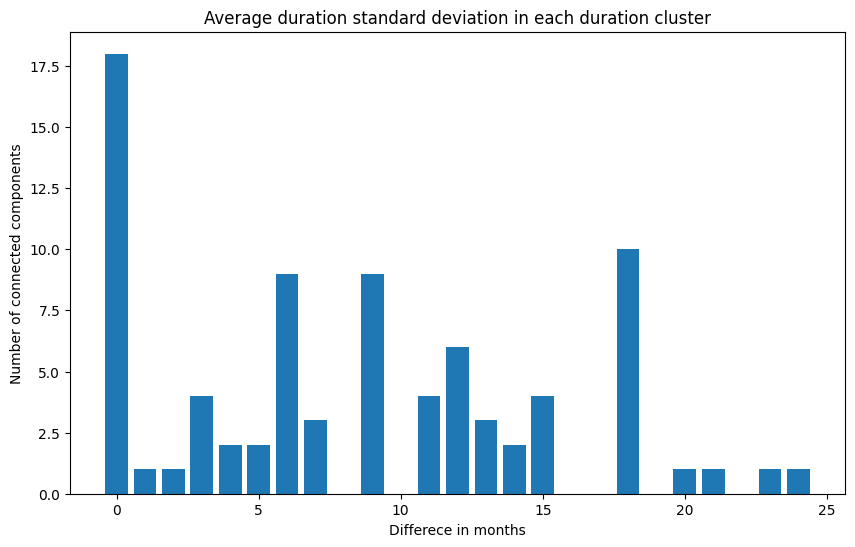 |
For the budget (on the left), it seems like most components don’t show much variation (89% have a standard deviation below €2M), which is good. It suggests ChatGPT might actually be capturing something meaningful. The picture for the duration difference (on the right) is more or less similar. Most projects (64.6%) have a standard deviation of 12 months or less, while others are mostly distributed around 18 months. Overall, there is some variation in project duration, but it’s within expected and acceptable limits.
How Much Can We Save?
We’re finally here! The last step of this long, figure-packed section.
The task now is to define what happens when X projects should be merged. Well, for now, let’s assume that each project in the connected components will contribute slightly more than half of its budget. Specifically, project j’s budget (B_j) will contribute C_j = B_j * (X + 1) / 2X. Seems fair to me.
So, considering a merge score of at least 3, all the projects in the graph account for €990.5M. If we apply the discount as previously mentioned, we can save €355.1M!! That’s a 46% saving—wow!
However, let’s put that into perspective. €355.1M is 0.374% of the Horizon budget and 5.4% of the AI-related projects in the Horizon budget… Well, that’s not much…
What happens if we decide that the budget for an ENTIRE component should only be the maximum budget among the projects? Well, not much changes. We now save €552.2M (64% of the total), reaching 0.581% of the Horizon budget and 8.5% of the AI-related projects. Plus, taking the max budget from the projects pool is very unlikely to be sufficient to push all of them forward.
Higher Merge Score
The percentage gets even lower if we consider only the projects with a merge score of 5 (the ones ChatGPT thinks should definitely be merged). In this case, we only get 8 connected components (with 17 projects), and only one component has three projects. Among these, 4 have nearly the same budget, while only 2 differ by more than €2M. Moreover, the max difference in project duration is 9 months. This makes sense, as projects with a high merge score should be quite similar.
If we go and check, the total budget for our super-similar projects is now €104.9M, and we can save up to €28.3M (27%). That’s 0.03% of the entire Horizon budget and 0.4% of the AI-related projects.
Considerations
So, here we are. We’ve got some results, so let’s try to put them in perspective.
DISCLAIMER: I don’t have to tell you that relying 100% on AI judgment is highly naïve and can lead to all kinds of dangerous and biased situations 9. Moreover, even though this kind of technique has been successful in some applications (like finding “good” data among web crawls), it doesn’t mean it will work in this context too. In general, the EU Commission has plenty of experts reviewing and granting funds, and my analysis is in no way comparable to the level of scrutiny they apply to their work.
That being said, there are some “positive” takeaways from what we found. First of all, we see that we are in a saving range between €28.3M and €552.2M. That’s a lot! Especially when considering the average project budget is €3.1M. We could fund between 9 and 178 new projects with those savings!
Moreover, as we saw earlier, the cosine similarity score doesn’t correlate much with our identified merge score. If we consider that we found 17 similar projects out of 196, that’s about 1 in every 12 projects being similar. If we assume the same similarity distribution applies across the entire Horizon Fund (wild assumption), we could be looking at 1,186 similar projects. Using simple (and admittedly naive) proportions, we could be looking at a savings potential in the range of: [28.3,552.2]/8*1186 = [4195,81863] = [4,41%,86,17%] of the entire Horizon fund
Of course, saving 86% of the entire fund is ridiculous and shows how using just proportions is wildly foolish. However, even managing to save half of the lower bound—2.2% of the Horizon Fund (approximately €2 billion)—is something to consider, in my opinion.
Conclusion
If you’re coming here from the intro, well, you missed some very nice-looking plots. Otherwise, we’ve covered a whole bunch of numbers, specifically:
-
Project Duration: The average project duration is 41 months, with shorter projects (under 5 years) being the majority. Projects starting in 2021 are more uniformly distributed in terms of duration, while those starting in 2025 tend to last only 1-2 years.
-
Budget Distribution: The average budget for AI projects is €3.161M, with 70% of projects having budgets below €3M. There is a modest correlation (0.31) between project duration and budget, indicating that longer projects tend to have slightly higher budgets.
-
Words Associated with Budgets: Terms like “rail,” “infrastructure,” and “environment” were correlated with higher budgets, while more general terms like “machine learning” and “research” were associated with lower budgets, suggesting different funding priorities based on project scope and impact.
-
Project Similarity: 2,065 AI-related projects were identified, showing significant overlap in key terms such as “machine learning” and “artificial intelligence.” However, a detailed cosine similarity analysis revealed only 478 pairs of projects with high textual similarity, with ChatGPT further refining this to 316 pairs with a moderate merge potential.
-
Potential Savings: The analysis of projects with ChatGPT’s merge score suggested potential savings of €355.1M to €552.2M by merging similar projects. This accounts for 0.4% to 8.5% of the total AI-related Horizon Europe budget, demonstrating a significant opportunity for resource optimization.
Thank you, ChatGPT, for that summary.
So, our analysis has confirmed the presence of overlaps within (AI) related Horizon projects.
Given this finding, in the next section blog post we will explore some potential solutions.
Footnotes
-
In “The future of European competitiveness – In-depth analysis and recommendations”, Draghi highlights a crucial issue: “Most importantly, member states do not coordinate their national public spending on research and development to align it to EU-wide priorities” (pg. 236). ↩
-
“EU is lagging behind US and China in investments in artificial intelligence, says audit report”. ↩
-
746 projects appear to have a budget of 0 in the
totalCostfield. This is likely due to projects in draft phases not yet reporting their total cost. Therefore, this analysis focuses on the European Commission’s maximum contribution (ecMaxContribution) ↩ -
For example, take protein folding, climate forecasting and drug discovery. ↩
-
A point could be made that the relationship might not be linear… fair enough, but that’s not the focus of this analysis. ↩
-
Interested readers can refer to scikit-learn’s “Text Feature Extraction” page. ↩
-
A connected component is a set of nodes (project) that share an edge (merge score). ↩
-
I have a whole section about this in my PhD thesis (Chapter 1). ↩